
Elections & the bigger picture
How Do Midterm Elections Affect Bitcoin and Stocks?
· By remi

Bitcoin and stocks can move sharply around midterm elections, but three past elections don’t prove the vote caused those moves. In 2014, 2018 and 2022, both fell before Election Day—and they didn’t follow the same script afterward.
Election season can make every red candle feel like a political opinion. So we looked at what actually happened around the 2014, 2018 and 2022 US midterms: six months before, then 30 and 180 days after.
How did Bitcoin and stocks perform around past midterms?
| Midterm | Largest fall before* Bitcoin / S&P 500 | 30 days after Bitcoin / S&P 500 | 180 days after Bitcoin / S&P 500 |
|---|---|---|---|
| 2014 | −51.7% / −7.4% | +11.8% / +3.0% | −27.6% / +4.8% |
| 2018 | −35.2% / −9.9% | −46.7% / −2.2% | −11.5% / +6.9% |
| 2022 | −41.9% / −16.9% | −7.1% / +3.5% | +53.5% / +8.1% |
*Largest peak-to-later-trough decline in daily closing prices during the 180 calendar days through election day—not necessarily the full cycle’s decline. Post-election changes compare each election-day close with the close 30 or 180 calendar days later; for stock-market holidays and weekends, the latest prior trading close is used. S&P 500 figures exclude dividends.
When did Bitcoin and stocks reach their lows?
In 2014, the S&P 500’s lowest close in our six-month window before the election came on October 15. Bitcoin’s lowest close in the six months after it came on January 14, 2015.
In 2018, both hit their lowest post-election closes in December: Bitcoin on December 15 and the S&P 500 on December 24. At the 180-day mark, stocks had moved above their election-day close, while Bitcoin remained below its own.
In 2022, the S&P 500’s lowest pre-election close was October 12. Bitcoin’s lowest post-election close was November 21, after FTX and affiliates filed for bankruptcy on November 11. By 180 days after the election, both were above their election-day closes. SEC filing
What Bitcoin cycle phase was each midterm in?
The remi Crypto Cycle Index puts each election in a bigger market story. Its historical chart places Bitcoin in Bear Market in 2014 and 2018; in both cases, Bitcoin reached its lowest close in our following six-month window after the vote. In 2022, the chart shows Accumulation at the election. Bitcoin still fell further before reaching its lowest close in that window, then stood 53.5% above its election-day close at the 180-day mark. Accumulation did not mean the bottom was already in.
Bitcoin after midterms: how far to the low?
From the election-day close to the lowest daily close in the following 180 days
Same phase, different point in time: Accumulation had lasted 85 days at the 2022 election; it has lasted 144 days as of today—59 days longer.
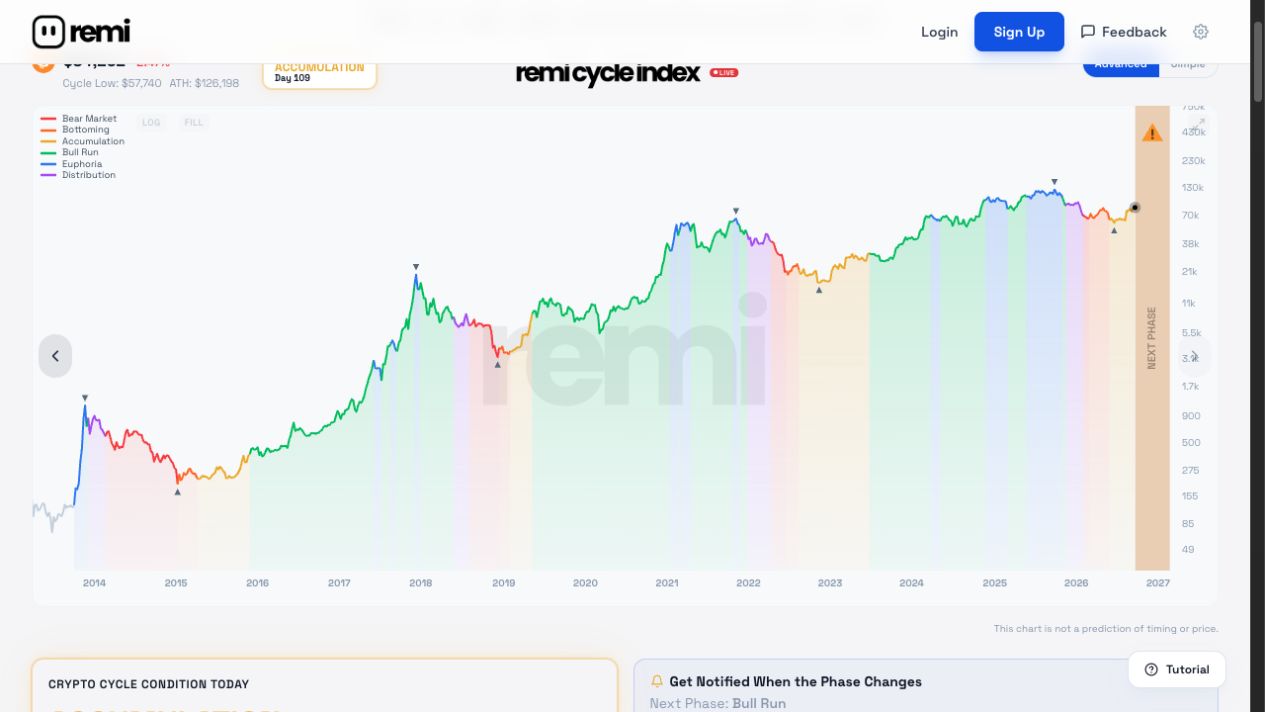
That’s why we start with the cycle. remi brings together multiple market indicators across different time frames to assess broader conditions, rather than treating a single headline as the whole story. News can add context—and sometimes challenge a thesis—but the market’s underlying conditions give us a useful place to start.
What changes after the election?
An election result can answer one big question: who won. It doesn’t instantly answer what policymakers will do—or what markets will do next. Investors may respond to uncertainty, but the result is only one part of the picture. Other economic and crypto-specific events can still move prices.
The last three midterms show meaningful moves around the vote across different election outcomes. They don’t establish that an election caused those moves or that markets are always more volatile at midterms.
Where does that leave us now? As of today, the Crypto Cycle Index shows Accumulation—the same phase its historical chart assigns to the 2022 midterm. This Accumulation phase had lasted 144 days, compared with 85 days at the 2022 election. Bitcoin fell further after that election before its later recovery, and the next cycle can unfold differently. As election news develops, remi gives you a way to follow the broader conditions alongside it.
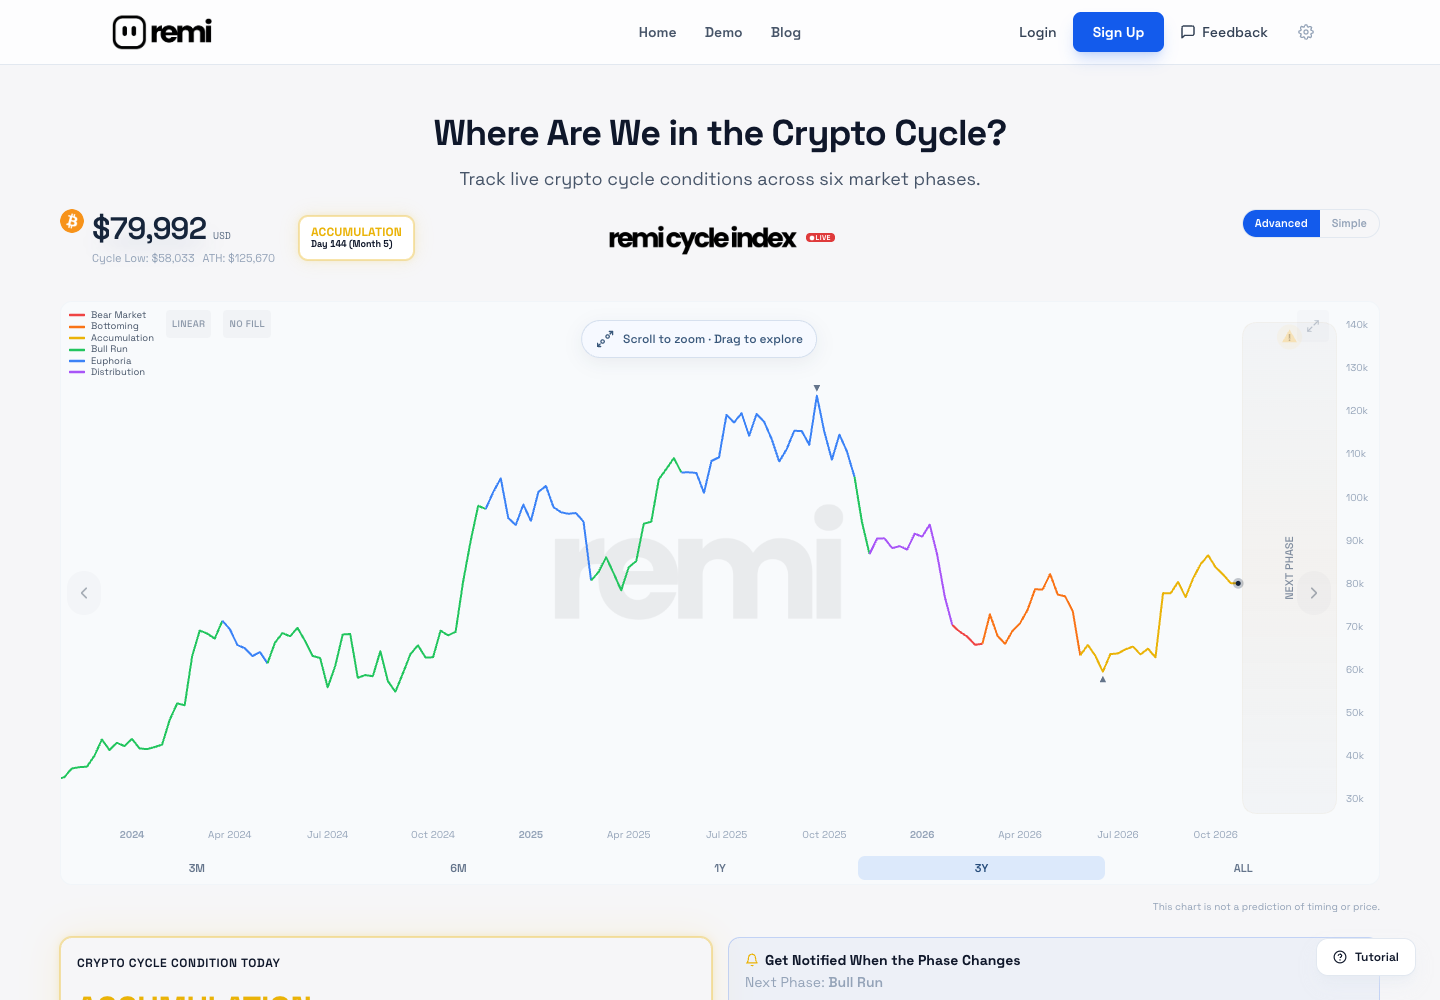
The remi Crypto Cycle Index. Check the live reading →
Sources: FEC election records; Bitstamp daily Bitcoin prices; S&P 500 historical price closes via Yahoo Finance. Prices and calculations are retained in the research notes. Bitcoin closes use UTC calendar days, and S&P closes use New York trading days.
Educational only, not investment advice. Markets are volatile and losses are possible. Past performance does not guarantee future results.