
remi / market questions
Does the Bitcoin Rainbow Chart Actually Work?
October 15, 2026 · By remi
Does the Bitcoin rainbow chart actually work? As a way to summarize past prices, it can be useful. As a reliable way to identify future tops and bottoms, a good historical fit isn’t enough—and the chart’s own history gives us reasons to be cautious.
What does the evidence show?
BlockchainCenter’s published history records two concrete limitations of earlier versions: Bitcoin’s 2021 cycle top didn’t come close to the red band, and in 2022 its price fell below the old chart’s lowest band. So neither “tops must reach red” nor “price stays inside the rainbow” held consistently.
The dynamic model’s reported R² measures how closely its curve fits the historical data used to calculate it. Even a high score does not tell you how often future predictions will be correct.
How is it calculated?
The current dynamic rainbow uses a power-law regression: it fits a curve to the relationship between Bitcoin’s historical price and time, then places colored bands above and below it. Each band shows price relative to that curve, not an independently measured level of market risk. New data changes the fit.
Has the rainbow chart changed?
Yes—and BlockchainCenter explains the changes openly. Its published history describes adding a lower band in 2022 after price fell outside the old bands, then introducing a new formula on November 21, 2022. The dynamic version refits its curve as new price data arrives.
Those updates are disclosed, not evidence of deception. But a revised fit needs a fresh test on future data. Looking convincing afterward is different from being useful beforehand.
Did the last peak reach the hottest colors?
In the dynamic chart captured below, the 2025 peak appears around the middle green-to-yellow bands, below red. That’s a retrospective view—not a verified record of what the model showed at the time.
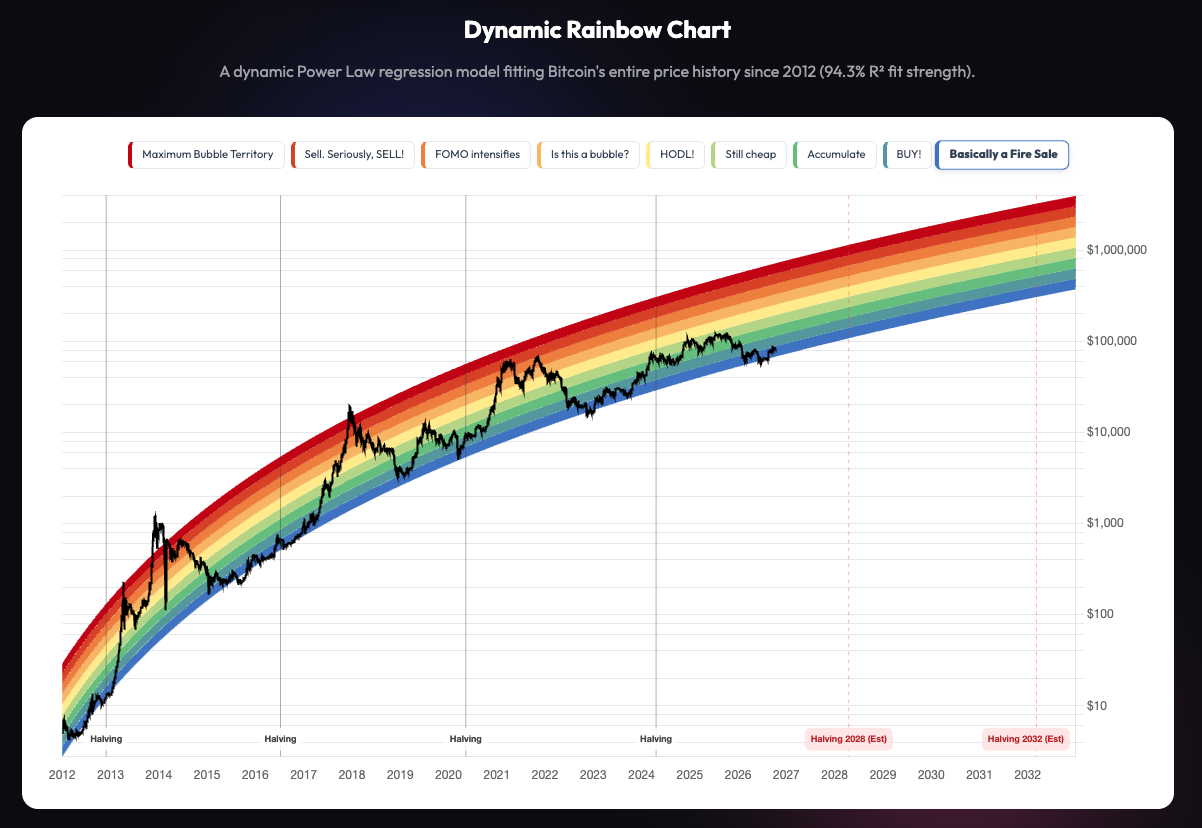
A dated 2025 capture is needed to assess a real-time missed call. The current screenshot alone can’t establish one.
What does remi help you see?
A rainbow band tells you where price sits against one curve. remi helps you understand where Bitcoin sits in the broader market cycle. When a price move has you wondering whether everything just changed, that bigger picture is useful.
remi combines 10+ indicators across different timeframes, looking for several pieces of evidence to agree before changing its phase. That agreement is called confluence. You get one readable cycle view instead of having to piece together a stack of separate charts.
Here are the six phases shown on remi’s chart:
In the example below, the yellow section shows Accumulation. A warning about a possible next phase is different from a confirmed phase change. It isn’t a countdown or a promise. The live Cycle Index shows the latest reading.
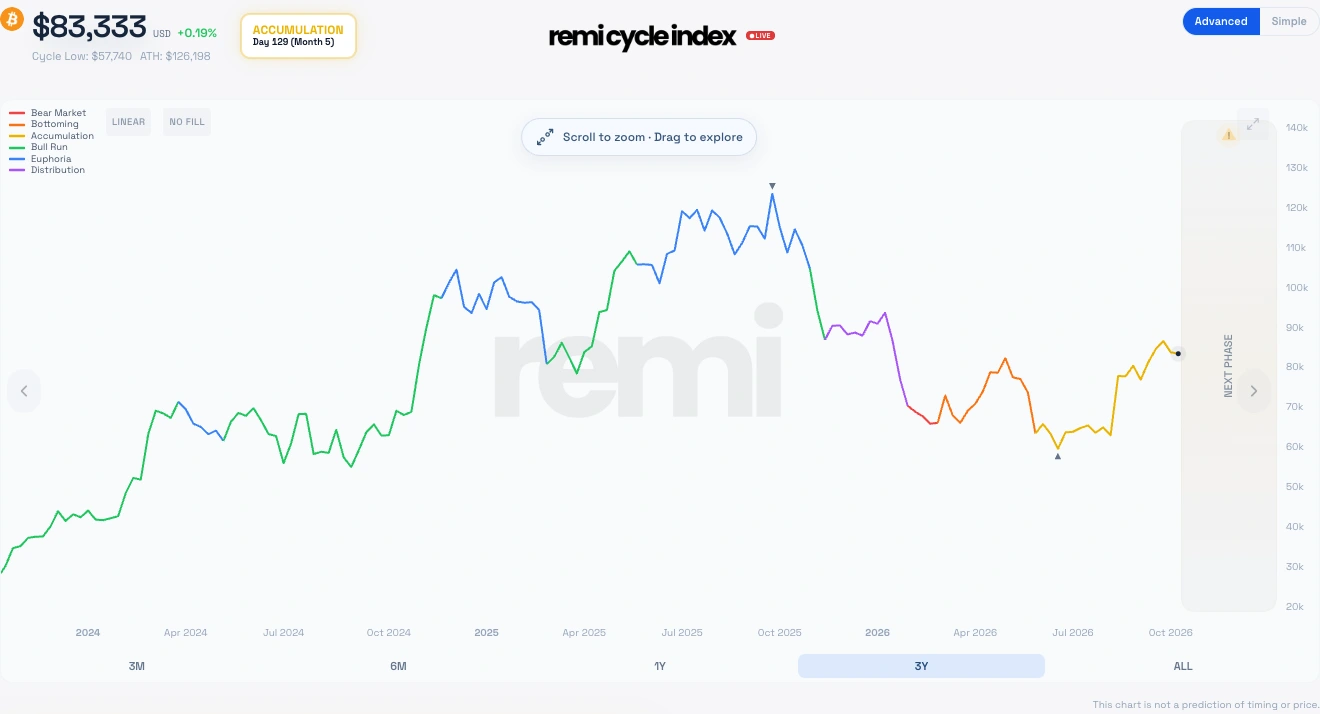
That’s the value of remi: a clear place to check the cycle when headlines pull your attention in different directions. It waits for more confirmation rather than treating one price move as a new chapter. Multiple indicators don’t guarantee accuracy.