
Why Is Bitcoin Going Up Today?
Updated 21 August 2026 · Educational market context, not financial advice
Four things stacked up at once. In the week of 17 August 2026, Bitcoin broke out of a range it had held since early July and printed a weekly high of $79,511 — up about 23% on the week. Reports at the time pointed to a US Treasury liquidity announcement, a large wave of forced short covering, renewed spot ETF inflows, and regulatory headlines out of Washington. That's the "why," as far as anyone can attribute it. The more useful question is where a move like that sits in the cycle.
Nothing here is financial advice — it's educational context for your own research.
What's driving the move
Rallies rarely get attributed to one cause, and this one wasn't either. Four things landed close together, and coverage at the time credited all four:
- A Treasury liquidity signal. The US Treasury said it would at least double its long-dated bond buybacks, from $2 billion to $4 billion or more per operation starting in September 2026 — the move most widely cited as the trigger. Risk assets often react to changes in expected liquidity.
- A short squeeze. Reports put short liquidations in the billions as the breakout began. Forced buying doesn't reflect a change of conviction — it's mechanical, and it can exaggerate the size of a move while it runs.
- Spot ETF inflows. US spot Bitcoin ETFs took in $606 million in a single day, up from $517 million the day before, per Fortune's coverage of the rally.
- Regulatory headlines. Crypto executives met with the White House alongside the heads of the SEC and CFTC, and the SEC announced proposed rules — the kind of news that markets read as reduced uncertainty.
Worth separating the durable from the mechanical. ETF flows and policy changes can persist — or reverse. A short squeeze is a one-off: once those positions are gone, that particular source of buying is finished. Any single week's move is usually some blend of both, and the blend is only clear afterward.
Where the move sits in the cycle
Here's the part the news cycle skips. Bitcoin's low this cycle was $57,740 in the week of 22 June 2026. The $79,511 print is about 38% above that low — and still about 37% below the cycle's high of $126,198, set in the week of 29 September 2025.
So the same move is, factually, both "up a lot" and "well below where it was." Which of those two facts feels true depends entirely on when you started watching. The chart doesn't have that problem — it just shows the phase.
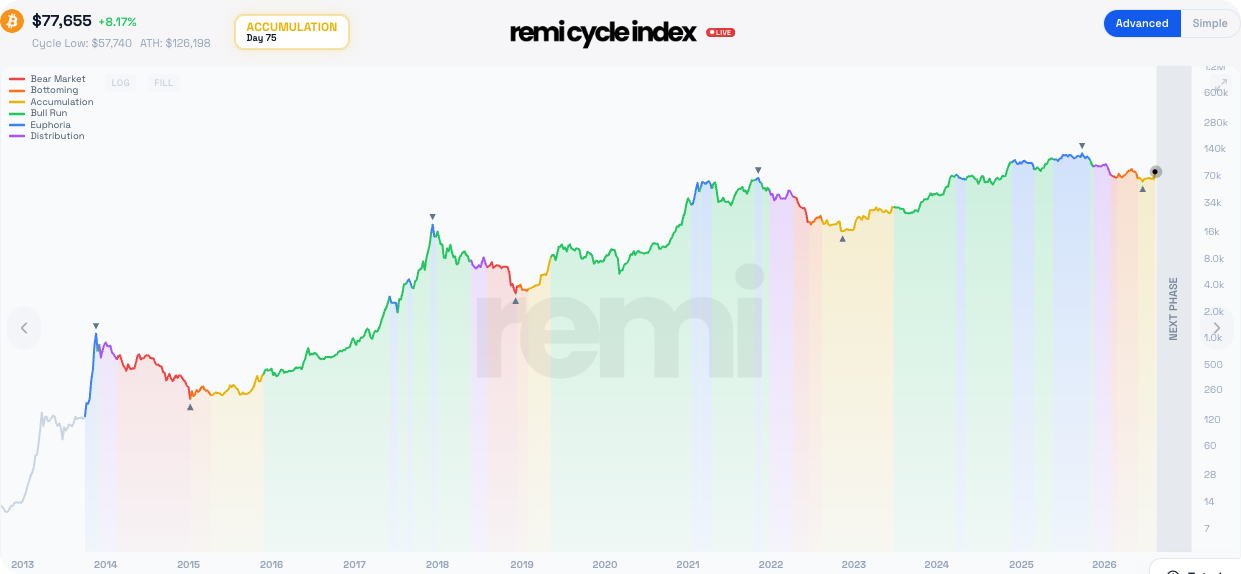
Rallies like this have happened inside Accumulation before
As of this writing the index reads Accumulation. What that label is worth isn't a forecast of what comes next — it's that you can go and look at what the last one actually contained.
The last accumulation phase ran from August 2022 to June 2023. Inside it, while the label never changed:
| Move inside the last Accumulation | From | To | Gain |
|---|---|---|---|
| Nov 2022 → Feb 2023 | $15,470 | $25,276 | +63% |
| Mar 2023 → Apr 2023 | $19,550 | $31,050 | +59% |
| Whole phase, low to high | $15,470 | $31,435 | +103% |
Weekly figures from remi's own chart data. They describe what already happened, are not projections, and may not repeat.
Both of those runs happened while the market sat in the same phase, and neither of them was the phase change. That's the point worth taking: on the recorded chart, the size of a rally on its own hasn't distinguished a change of chapter from ordinary movement inside one. Accumulation there wasn't a flat line — it was a choppy stretch that produced moves large enough to feel like the start of something, and drawdowns large enough to feel like the end of something. It may or may not behave that way again.
So did I miss it?
Honestly: that isn't knowable in the moment. Historically, whether a given week was the start of something has only been clear well afterward. What is knowable is narrower — which phase the market is in, how long that phase has been running, and what the same phase has done before.
That's the whole reason to check a cycle reading when a price headline hits your feed rather than after. A number on its own — $79,000, or any other — carries no context. The same number means something different in Accumulation than it does in Euphoria, and the label is observable today while the outcome isn't. If you're weighing the buying question specifically, we treated it separately in is now a good time to buy Bitcoin?
Check it before you chase it
remi melts a range of market indicators into one educational read on the cycle, across six phase labels. No hype, no price targets. Set up a free account and remi can email you when the cycle phase changes — educational updates, sent when the label moves.
View the Crypto Cycle Index →Educational only. Not a trading signal or a recommendation to buy, sell, or hold. Crypto is highly volatile — phase updates don't reduce the risk of loss.
Common questions
Why is Bitcoin going up?
In August 2026, reporting on the move pointed to four things landing at once: a US Treasury announcement to at least double long-dated bond buybacks, short liquidations running into the billions, spot ETF inflows of $606 million in a day, and regulatory headlines from a White House crypto meeting and proposed SEC rules. Rallies are usually attributed to several causes rather than one, and the attribution is always made after the fact.
Does a rally mean the bull run has started?
Not on its own. On the recorded phase history, the last accumulation phase contained rallies of 63% and 59% without the phase label changing. A phase change is an observable event when it happens; a single strong week isn't the same thing. More on that in when is the next crypto bull run?
Is Bitcoin still down from its all-time high?
As of August 2026, yes — the $79,511 weekly print sits about 37% below the record high of $126,198 recorded in the week of 29 September 2025, and about 38% above the June 2026 low of $57,740. Both are true at the same time.
What is a short squeeze, and why does it matter here?
When price rises against traders positioned for a fall, their positions can be closed automatically, which means buying. That buying pushes price higher, closing more positions. It's mechanical rather than a change in conviction, and it stops once those positions are gone — which is why squeezes tend to move price quickly and then fade.
How will I know when the cycle phase changes?
The remi Cycle Index updates daily, and a free account can email you when the phase label moves — the observable event, rather than a predicted date. If the market turns the other way instead, we covered that side in why is crypto crashing?
Not financial advice
remi is an educational market-intelligence tool. Nothing on this page is investment, financial, legal, or tax advice, and nothing here is a recommendation to buy, sell, or hold any asset. Use remi as educational market context, not as personalized financial advice. Cryptocurrency is highly volatile and carries significant risk, including the risk of total loss — always do your own research and consider speaking with a licensed professional before making any decision.
Photo by Rafael Minguet Delgado on Pexels.
Last updated: August 2026 · Cycle Index · Blog · Privacy · Terms